Pages Side

Showing posts with label PowerBI. Show all posts

Saturday, December 17, 2022

Power BI : What's the Data Analysis ?


Overview Data Analytics?

As the world becomes more data-driven, storytelling through data analysis is becoming a more vital component and aspect of businesses large and small and is the reason organizations continue to hire data analysts.

Data-driven businesses make decisions based on the story their data tells, and data is not being used to its full potential, a challenge that most business face today. Data analysis is and should be a critical aspect of all organizations to determine the impact to their business, including customer sentiment, market and product research, identifying trends, or any other data insights.core components of analytics are divided in the following categories:


Descriptive analytics

Descriptive analytics helps answer questions about what has happened, based on historical data. Descriptive analytics techniques summarize large datasets to describe outcomes to stakeholders By developing KPIs (Key Performance Indicators), Specialized metrics are developed to track performance in specific industries.

Examples of descriptive analytics include generating reports to provide a view of an organization's sales and financial data


Diagnostic analytics

Diagnostic analytics helps answer questions about why things happened. They take the findings from descriptive analytics and dig deeper to find the cause. The performance indicators are further investigated to discover why they got better or worse. This generally occurs in three steps:

  1. Identify anomalies in the data. These may be unexpected changes in a metric or a particular market.
  2. Collect data that are related to these anomalies.
  3. Use statistical techniques to discover relationships and trends that explain these anomalies.


Prescriptive analytics

Prescriptive analytics helps answer questions about what actions should be taken to achieve a goal or target. By using insights from predictive analytics, data-driven decisions can be made. This technique allows businesses to make informed decisions in the face of uncertainty. Prescriptive analytics techniques rely on machine learning strategies to find patterns in large datasets. By analyzing past decisions and events, the likelihood of different outcomes can be estimated.


Cognitive analytics

Cognitive analytics attempts to draw inferences from existing data and patterns, derive conclusions based on existing knowledge bases, and then add these findings back into the knowledge base for future inferences, a self-learning feedback loop. Cognitive analytics helps you to learn what might happen if circumstances change, and how you might handle these situations.

Inferences aren't structured queries based on a rules database, rather they're unstructured hypotheses gathered from several sources and expressed with varying degrees of confidence. Effective cognitive analytics depends on machine learning algorithms. It uses several NLP (Natural Language Processing) concepts to make sense of previously untapped data sources, such as call center conversation logs and product reviews.


Roles in data


The following highlights the different roles in data and the specific responsibility in the overall, end-to-end spectrum of data discovery and understanding.


Business Analyst

While there are some similarities between a data analyst and business analyst, the key differentiator between the two roles is what they do with data. A business analyst is closer to the business itself and is a specialist on interpreting the data that comes from the visualization. Often the data analyst and business analyst could be the accountability of a single person

Data Analyst

A data analyst enables businesses to maximize the value of their data assets through visualization and reporting tools such as Power BI. Data analysts are responsible for profiling, cleaning, and transforming data, designing, and building scalable and performant data models, and enabling and implementing the advanced analytics capabilities into reports for analysis. They work with the appropriate stakeholders to identify appropriate and necessary data and reporting requirements and then are tasked with turning raw data into relevant and meaningful insights.

A data analyst is also responsible for the management of Power BI assets, including reports, dashboards, workspaces, and the underlying datasets used in the reports. They are tasked with implementing and configuring proper security procedures, in conjunction with stakeholder requirements, to ensure the safekeeping of all Power BI assets and their data.

Data analysts work with data engineers to determine and locate appropriate data sources that meet stakeholder requirements and work with both the data engineer and database administrator to ensure the data analyst has proper access to the needed data sources. The data analyst also works with the data engineer to identify new processes or improve existing processes for collecting data for analysis.

Data Engineer

The primary responsibilities of data engineers include the use of on-premises and cloud data services and tools to ingest, egress, and transform data from multiple sources. Data engineers collaborate with business stakeholders to identify and meet data requirements. They design and implement solutions.

A data engineer adds tremendous value to both business intelligence and data science projects. When the data engineer brings data together, often described as data wrangling, projects move more quickly because data scientists can focus on their own areas of work.

Both database administrators and business intelligence professionals can easily transition to a data engineer role. They just need to learn the tools and technology that are used to process large amounts of data.


Data Scientist

Data scientists perform advanced analytics to extract value from data. Their work can vary from descriptive analytics to predictive analytics. Descriptive analytics evaluate data through a process known as exploratory data analysis (EDA). Predictive analytics are used in machine learning to apply modeling techniques that can detect anomalies or patterns. These are an important part of forecast models.

Descriptive and predictive analytics are just one aspect of data scientists' work. Some data scientists might even work in the realms of deep learning, iteratively experimenting to solve a complex data problem by using customized algorithms.

Database Administrator

A database administrator implements and manages the operational aspects of cloud-native and hybrid data platform solutions built on Microsoft Azure data services and Microsoft SQL Server. They are responsible for the overall availability and consistent performance and optimizations of the database solutions. They work with stakeholders to identify and implement the policies, tools, and processes for data backup and recovery plans.

The role of a database administrator is different from the role of a data engineer. A database administrator monitors and manages the overall health of a database and the hardware it resides on, whereas a data engineer is involved in the process of data wrangling, i.e., ingesting, transforming, validating, and cleaning data to meet business needs and requirements.

The database administrator is also responsible for managing the overall security of the data, granting and restricting user access and privileges to the data as determined by business needs and requirements.


Monday, December 5, 2022

Power BI : What's the Limitation Power BI with MSSQL Express !?

 To able to answer this question we need to clarify Which power BI component (Power BI Desktop Or Power BI Report Server) and what's purpose.


Need to connect to MSSQL Express to bring the data?

Power BI Side,

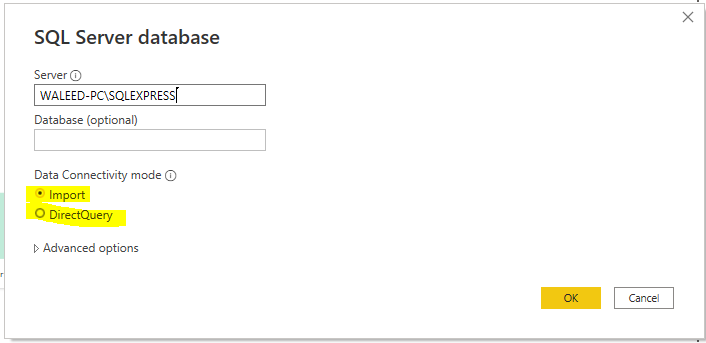
you will able to connect using Direct Query Or Import Type 


MSSQL Side,

But there are many Limitations will be from the MSSQL Express itself as below

  1. 1GB maximum memory used by the database engine
  2. 10GB maximum database size
  3. 1MB maximum buffer cache
  4. CPU the lesser of one (1) socket or four (4) cores (number of SQL user connections NOT limited)

Build Power BI Environment,

For build a Power BI Environment it requires MSSQL Enterprise license to configure the Power BI Report Server

Thursday, December 1, 2022

Power BI : What's the Different Connection Type Import, Direct Connect and Live Connect


 When we are talking about the Connection types, I didn't mean that the Data type which are Excel or SQL Server ..etc
I mean we have 3 Major connection types in Power BI as below 
The first is the most widely used and is the default when connecting to most data sources. It is Import. This connection will ingest or pull the data from the data source and become part of the PBI Desktop file.  An example of where you would select import Is in the SQL Server dialog box.


1- The Import Type

You can import data from a SQL Server by clicking Get Data on the Home ribbon.


The import connection type allows you to use the full capabilities of the Power BI Desktop and you can manipulate it however you see fit. A way to validate this is by looking at the left-hand navigation and you will see three selections.  The top selection which resembles a bar chart is the Report Page.  This is where you would place all your visuals and develop your report pages.  The second item from the top, which looks like a table is just that, the Data view in a table form.  This lets you see all the data contained with a loaded data table.  Finally, at the very bottom, the relationships selection.  This is where you will see multiple tables and the connections between the tables.  The relationships section feels like working SQL or in Microsoft Access


2- Direct Query

We Will Notice that notice in direct query mode the third item, relationships have been removed.  The direct query connection type is only available when you connect to certain data sources. This connection is unique in that the data does not get loaded into the PBI Desktop.  What happens, is that Power BI can communicate in the language of the data source and request information as you interact with your Power BI Visuals. The useful thing about this connection is that the data never leaves the data sources, it is only queried.  Direct Query does limit what you can do from a data manipulation perspective.  Power BI assumes you are already doing all the necessary data manipulations in your source. As a result, you don’t even have the option to mashup data and that selection is removed in the left-hand nav.


3- Live Connection

There are only 3 data sources that support the live connection method at this time.  All of them are a type of (SSAS) SQL Server Analysis Service. Those types are Multidimensional, Azure Tabular and Tabular on-premises. The live connection type is the most unique in that it recognizes the full model or cube that you’ve created.  Power BI Desktop turns off all data prep features.  Thus, the usr is given a bare minimum in formatting and report side calculations.  All the heavy lifting is done on the server that supports the model and Power BI is only used as a reporting tool. This connection is used mainly by IT and enterprise implementations. If one looks at the left-hand navigation, you quickly realize that it is the most restrictive in terms of what can be done in the Desktop itself.

There is a fourth Live Connection that defaults to the connection type, and this occurs when you use the Power BI Service as a data source. This connection is using a SSAS connection, only the end users don’t need to set anything up other than having dataset to connect to in the Service.


And Find below the feature summaries for each connection type


Finally, there are two types of connections that dive a bit deeper than what comes with the Desktop out of the box. Those are Custom Data Connectors and API/Streaming. For the time being, we’ll leave these as just high-level points for now, and dive deeper into them in specific articles in the future.
I hope you’ve found this initial primer useful. As this series continues we’ll dive into some of the reasons for using each of these types of connections, why you would want to, and the positives and negatives in choosing which one, provided you have a choice
Good luck and thanks for following along.

Tuesday, November 29, 2022

Power BI: HTTP Error 503. The service is unavailable


After configuring the Power BI Report Server, If you have tried to browse the Power BI Portal URL, you may get this error “HTTP Error 503. The service is unavailable.“


In Power BI Report Server, this issue "HTTP Error 503 The service is unavailable" almost because of one of the below reasons 


  1. The PowerBI Report Server service is stopped. 
  2. The PowerBI Report Server service Account is disabled or its password expired 
  3. The PowerBI Report Server service account is not configured properly. 
  4. The Power BI Report Server is not configured properly.

The Solution is

Start PowerBI Report Server Service

1. Open run and type "Services.msc" and then ok


2. Search for PowerBI Report Server.


3. Make sure that the service account that runs the PowerBI Report Server service is the same account that you have provided during configuring the service account in Report Server Configuration.


4. Restart/Start the service if it was stopped


Saturday, November 26, 2022

Power BI: How to Edit SQL Query In Power BI step by step


 Able to update the existing SQL statement, you have to follow the below Steps :

You are Open to DashBoard Power BI Desktop

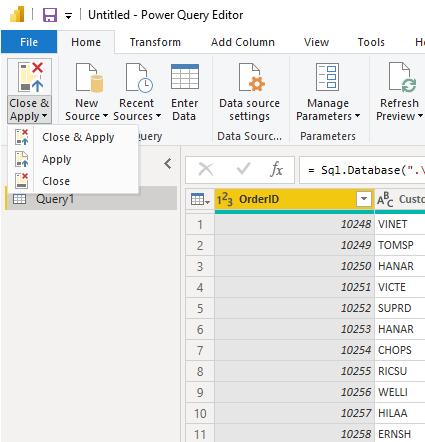
1- go to Query Editor Home>>Transform Data >> Transform Data


2- Open Query Setting   On the Left side you will fine the query List, Select which one you want to edit

3- Open Query Setting   On the Left side >> Query Setting >> Select the Source

4-Click on the Setting icon gear beside the Source to edit the Query Source


5-it will open SQL Server database settings would be shown, you can edit your SQL statement as you prefer


6- Then Close & Apply to effect on your Dashboard


Thursday, November 24, 2022

Power BI: Loading Data From Folder

 Open up PowerBI Desktop and click on the Get Data button and select All on the left side.  Click on the item labeled Folder and click Connect to continue

 Click OK to continue. Upon opening that folder location you will be presented with the multiple files.  Click Edit to edit the query


Edit Query for Folder Load

Now you are in the Query Editor.  This is where the fancy query editing will work to our advantage.  We could load all the data into one large query.  However, depending on the size of your data sets or how you want to report your data this may not always be desirable.  Instead, you may only want data from April, then May when the new data is sent next month.

Note:  When using PowerBI desktop it is a good practice to name the files  beginning with a YYYY-MM-DD file name.  This makes it really easy when sorting and ingesting information into PowerBI.  I have used other columns of information such as Date Accessed or Date Created before but have gotten inconsistent results as these dates can change depending on when a file was moved or copied from one place to another.

Click the drop down next to Name and sort the files in Sort Descending.


This places the files with the most recent file at the top of the list.

Next click on the Keep Rows button on the Home ribbon, select Keep Top Rows.


Enter the number 
when the popup appears.  Click OK to continue.


Keep Top Rows Menu

Now you’ll notice you have only one file selected which is our latest file from April.  Click the Load File button found in the Content column.


Load File Button

We have completed the activities in the Query Editor and can now load the data.  Click Close & Apply found on the Home ribbon.  All our April data has loaded.  by making a simple table we can now see all the data that was just loaded.


Loaded Data from April

Now we will remove some data from our desktop folder labeled monthly data.  Open the folder on the desktop labeled Monthly Data and delete the filed labeled 2016-04-01 April.  You should now have a folder labeled Monthly Data with only two files in it, one for Feb and one for March.


Two Files Left

Return back to Power BI Desktop and click the Refresh button on the Home ribbon.  Notice now how all our data has changed.  We are now looking at the March data because it is the most recent file in our folder based on the file name.


March Data Load

To verify this we open the query editor (Click the Edit Queries on the Home ribbon).  Click Refresh Preview on the Home ribbon and finally select the Applied Step called Kept First Rows.  This will reveal the month of March as our data source.


Now, every time you add a new file to our folder and refresh PowerBI the latest file (based on the naming convention we talked about earlier) will always be loaded.

Note: This method works great when your data source is coming from an automated system.  The file format must always be the same for this to work reliability.  If the file naming convention changes, or the number of columns or location of those columns changes then the query will most likely fail.

Good luck and thanks for following along.